
Are Bonds Signaling Recession?
The financial markets are adept at stirring investor emotions through unexpected volatility and price momentum. Volatility is certainly prevalent and there is now constant discussion about the inverted yield curve and what that may be predicting. An inverted yield curve is an interest rate environment in which long-term debt instruments have a lower yield than short-term debt instruments of the same credit quality.
Richard Carter, Vice President of Fixed Income products with Fidelity, makes some very interesting points in this article addressing stock market volatility and the phrase “inverted yield curve”.
THE IMPORTANCE OF STAYING THE COURSE
When the market gets jumpy, so do investors. In periods of volatility, anxious stock market investors can be tempted to take money off the table, fearing a potentially major slide in their portfolio. Take this past May, for example. Stocks began to waver early in the month, when a presidential tweet regarding tariffs re-inflated investor concerns over a possible trade war between the U.S. and China. Investors responded by moving their money from equities to fixed income. Investors who missed out on the May downdraft made out. Say you were able to exit stocks following the president’s May 5th tweet. You would have avoided a 6.6% slide in the S&P 500 from then through May 31. But before congratulating yourself on a savvy piece of market timing, ask yourself if, or when, you planned to buy back in. After all, from the end of May through June 14, the market had already bounced back by nearly 5%.
Stay invested – exiting stocks amid a turbulent market may help assuage your anxiety, but you are likely to miss out on substantial gains while you sit on the sidelines. That’s because much of the market’s long-term performance is driven by returns from a few outstanding days. Remember the S&P 500’s 15.1% annualized return over the course of the current bull run? If we leave out the five best days of each year for the market, the annualized return plummets to a measly 1.1%. On an initial $10,000 investment, that’s the difference between ending up with about $40,000 and about $11,000. And if you think you’ll be able to pinpoint when to exit and then get back in the game, think again. Since the bull began in 2009, 40% of the market’s five best days of the year have occurred within a week of the five worst days. Investors who don’t have a crystal ball are better off staying fully invested than attempting to wring gains from short-term market timing moves.
It helps to anticipate short-term bouts of volatility and to have a plan in place for when those stretches occur. Make sure your portfolio’s asset allocation aligns with your tolerance for risk. If a major decline in the stock market would keep you up at night or cause you to panic and liquidate your nest egg, consider pruning back your stock allocation or adding an investment intended to mitigate volatility.
Learn what has happened historically when long-term yields fall below short-term ones.
Key takeaways
- Yields on longer-term US Treasury securities have fallen below those on short-term Treasurys.
- This unusual relationship between yields may indicate that investors are concerned a recession is approaching.
- Investors should maintain an appropriate asset allocation and not make abrupt decisions due to concerns about an eventual economic slowdown.
With yields on 10-year US Treasury notes having fallen below yields on 2-year notes for the first time since 2007, the phrase “inverted yield curve” has found its way back into the media and back into investors’ conversations. It’s unusual for yields on fixed income securities that mature in the relatively near future to be higher than on those that mature at a more distant point in time, but it’s not the first time this year it’s happened. Yields on 3-month Treasury securities moved higher than those on 10-year notes earlier in 2019.
Conventional wisdom says that when the curve inverts, a recession is drawing near. But history shows that an inverted yield curve forecasts recession much in the same way that autumn forecasts winter: While one eventually follows the other, nothing indicates precisely when it will happen—or what to do about it. What an inverted yield curve does tell investors is that they should be cautious.
What the curve is
To understand what message a yield curve may be sending, an investor first needs to understand how the curve works. A yield curve is a line connecting dots that represent the yields of bonds of various maturities when they are plotted on a graph. While yield curves can be created to reflect a wide variety of bond categories, investors usually use the term to mean the curve of US Treasury securities spanning the yields available from 3 months out to 5, 10, and 30 years.
Typically, the yield curve slopes upward from the short-term maturities on the left end of the curve to the long-term ones on the right. This reflects the fact that short-term bonds typically offer lower yields because they pose relatively little risk to an investor’s money. Longer-term bonds typically pay more to compensate investors for accepting a fixed rate of interest despite the risk that future inflation could erode the bond’s real return and for forgoing potentially higher interest rates in the future.
The curve turned upside down
While interest rates set by the Federal Reserve have a significant impact on shorter-term Treasury yields, the sentiment of investors and their demand for various types of bonds determines the shape of the yield curve. When investors expect the economy to grow and inflation to remain modest, they seek a wide variety of types of investments. At these times, the yield curve typically slopes upward. The average yields on 30-year Treasury bonds have typically been 2.3 percentage points higher than average yields on 3-month Treasury bills over the past 30 years.
However, when investors become concerned that growth may slow and markets may turn volatile, they often seek shelter in longer-term Treasury bonds. Other investors, fearing that the Federal Reserve may begin to cut their federal funds target rate, may sell short-term bonds and seek to lock in the yields of longer-term bonds before they fall. When that happens, the surge in demand for those long-term bonds may push their yields down to the point at which they are lower than those of shorter-term bonds and the yield curve inverts, sloping downward from left to right. While the Federal Reserve recently cut the Federal funds rate by 0.25%, yields on longer-dated Treasury notes, which are set by the market, have fallen much further. Since the start of the year, yields on 2-year notes have fallen by about 0.91% and yields on 10-year notes have fallen by about 1.10%.
What does it mean?
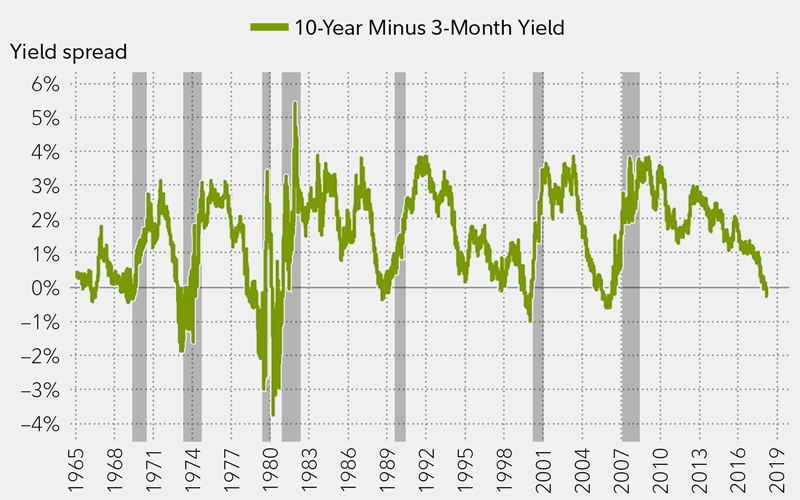
Inverted yield curves are uncommon, but it’s not just their novelty that makes them worth paying attention to. They often appear late in economic cycles as investors grow anxious about signs of an approaching recession such as slowing growth and tightening credit. Indeed, the inversion of the spread between the 3-month Treasury bill and the 10-year Treasury note has preceded each recession since 1967. Historically, as the chart below shows, the US economy has gone into recession an average of 14 months after the inversion of the yield curve.
US Treasury yield curve
Curve inversions have preceded the past 7 recessions, but the time between the inversion and the recession has varied.
What to do about an inverted curve
While history does not repeat, it often rhymes. The inversion of the yield curve between 3-month and 10-year Treasurys that took place in 2019 does not mean the economy will enter recession exactly 14 months later in 2020. Indeed, the inversions that took place in 1966 and 1998 were not followed by recessions. However, an inverted yield curve does strongly remind investors that recessions are inevitable and that they should be careful to maintain proper asset allocation in their portfolios, rather than trying to make tactical moves in anticipation of the market downturns that often accompany economic slowdowns.
Whether you believe in the recession-predicting power of the yield curve or not, you may want to consider rebalancing your portfolio to keep your asset mix appropriately diversified between stocks, bonds, and cash. Richard Carter, vice president of Fixed Income Products with Fidelity, says that the message the inverted yield curve sends to investors is to stay true to their personal goals. “Ask yourself, ‘Where am I in life? How risk-tolerant am I?'” he says. “Those answers can help you come up with a mix of cash, fixed income investments, and stocks that will be suitable for your goals and time horizons regardless of market conditions.”
Carter recommends not only diversifying your portfolio between stocks and fixed income, but also making sure to diversify within your allocation to fixed income. “Just as you’re advised to diversify your entire portfolio, you should create balance within your fixed income assets. For example, you could reduce credit risk by adding higher-quality bonds, certificates of deposit, money market funds, and fixed annuities,” he says. “That may also mean investing in fixed income products that mature at different times.”
“Even with an inverted yield curve,” says Carter, “longer-term bonds of the highest credit quality can often provide the potential for capital gains and steady income should prices of riskier assets and short-term bond yields both fall as a recession unfolds and stock market volatility increases. Typically, after we come through a recession—as we did in 1992, 2002, and 2010—short-term yields have fallen, the economic cycle will begin again, and the yield curve will steepen once more.”
Original Article Source: Fidelity